In January, the Maryland State Department of Education released the 2022 Maryland Comprehensive Assessment Program (MCAP) results. Those results show the varying performances of county public school systems. It was the first such assessment data since 2019, due to the pandemic. Prince George’s County Public Schools (PGCPS) showed several areas of concern, particularly in math proficiency (see “PGCPS Students’ Declines in Math Called ‘Concerning’” in the February 2 issue of the News Review).
On March 9 the Department of Education released further data showing performance at the individual school level. Despite the bleak aggregated data for the county, an announcement from PGCPS on March 9 touted that 71.4 percent of schools received the three highest ratings (it was a five-star rating system). “State ratings offer a snapshot of how schools are helping students achieve success in the classroom and beyond and we use it as a tool to strengthen teaching and learning,” said Dr. Monica Goldson, chief executive officer. “I am proud of our continued progress and work to accelerate learning and close achievement gaps. Every student deserves a five-star school and I know we can get there.”
Based on the schools’ overall scores, each received a 1 to 5 star rating, as well as a percentile ranking of their position within public schools of their category – either elementary, middle or high – in the State of Maryland (with 1 being the lowest percentile and 100 the highest). Here’s how Greenbelt’s schools fared individually in the state’s school report cards:
Greenbelt Elementary
Overall rating: 4 stars
Percentile Rank: 48
In students’ performance on state tests, 20.3 percent of students met proficiency in math and 41.2 percent in English Language Arts (ELA). The school earned 2.4 out of 5 points for average performance level in mathematics and 3 out of 5 points for average performance level in ELA.
In measures of academic progress, 40 percent of students were proficient in science, and the school earned 5.6 out of 12.5 for student growth in mathematics, 8.7 out of 12.5 for student growth in ELA and 4.9 out of 5 for a well-rounded curriculum.
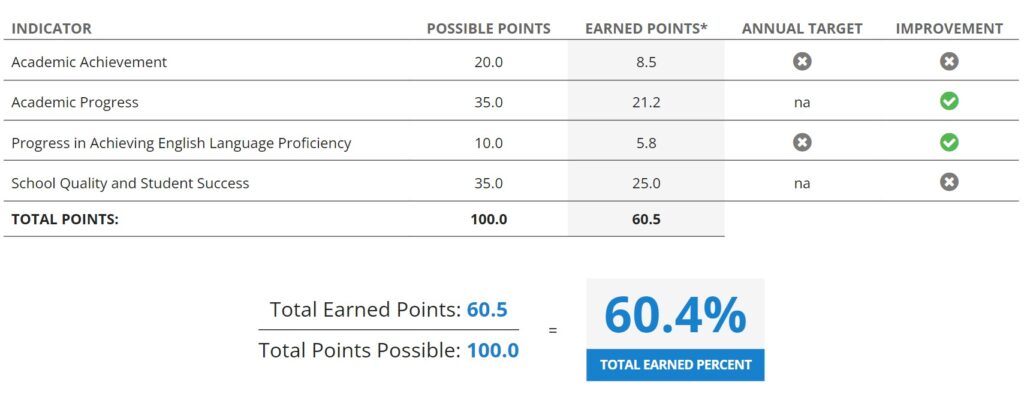
In progress toward English language proficiency for English learners, the school earned 5.8 out of 10 points. They earned 25 out of a possible 35 points for quality of school environment.
Greenbelt Elementary did not meet the target for academic measures (a combination of academic achievement, academic progress and progress in achieving English language proficiency) but did see improvement. On academic measures (academic achievement, academic progress and progress in achieving English language proficiency) the school earned 36 of a possible 65 points, which did not meet targets but did show improvement. In measures of school quality and student success (a combination of students not being chronically absent, access to well-rounded curriculum and student and educator surveys) the school earned 25 of a possible 35 points, which did not show improvement.
In breakdown by demographics only, Asian students met the annual target for ELA, though Asian students and English learners both showed improvement. In math, no groups met annual achievement targets but Asian students met the improvement measures. The average for all students was 20.3 percent proficiency in math, with students with disabilities and Hispanic/Latinx students 5 percent or less proficient in math. In ELA the average proficiency for all students was 41.2 percent, the best performing group being Asian students, of which 75 percent were proficient and the least proficient were students with disabilities at 5 percent or less.
Springhill Lake Elementary
Overall rating: 2 stars
Percentile Rank: 15
In students’ performance on state tests, 5 percent or less of students showed proficiency in math and 17.4 percent in ELA. The school earned 1.8 out of 5 points for average performance level in mathematics and 2.4 out of 5 points for average performance level in ELA.
In measures of academic progress, 8.6 percent of students were proficient in science and the school earned 1.6 out of 12.5 for student growth in mathematics, 2.8 out of 12.5 for student growth in ELA and 4.7 out of 5 for well-rounded curriculum.
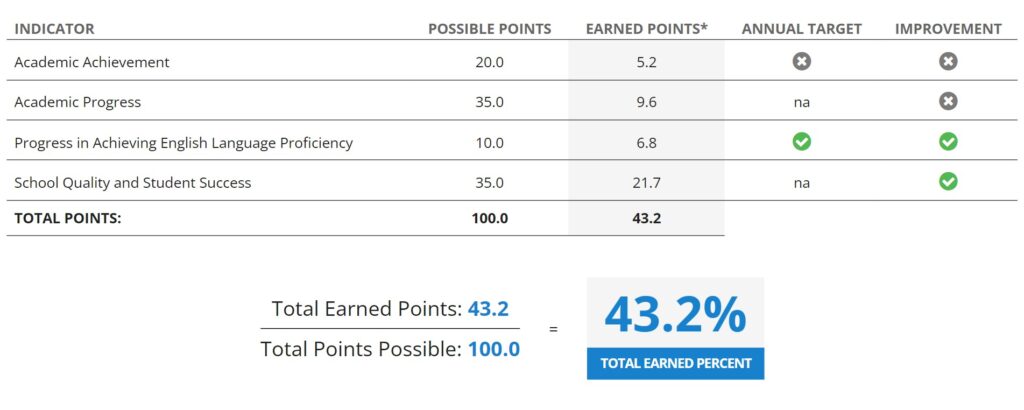
In progress toward English language proficiency for English learners the school earned 6.8 out of 10 points based on the state measures. They earned 21.7 out of a possible 35 points for quality of school environment. It did not meet the target for academic measures nor did it show improvement in these. In measures of school quality and student success, the school earned 22 of a possible 35 points, which met the target for improvement.
Breakdown by demographics shows no student groups achieved 5 percent or greater proficiency in math. The average percentage proficiency in ELA across all students was 17.4 percent, the highest achieving group was Hispanic/Latinx with 18 percent testing proficient and the lowest was students with disabilities with 6.7 percent proficient in ELA. No groups met any targets for proficiency in math or ELA and the English learner category of students alone showed improvement, which was with 16.9 percent proficiency in ELA.
Magnolia Elementary
Overall Rating: 3 stars
Percentile Rank: 34
In students’ performance on state tests 7.8 percent of students met proficiency in math and 32.7 percent in ELA. The school earned 2 out of 5 points for average performance level in mathematics and 2.7 out of 5 points for average performance level in ELA.
In measures of academic progress, 25.7 percent of students were proficient in science, and the school earned 3.6 out of 12.5 for student growth in mathematics, 5.6 out of 12.5 for student growth in ELA and 4.9 out of 5 for well-rounded curriculum.
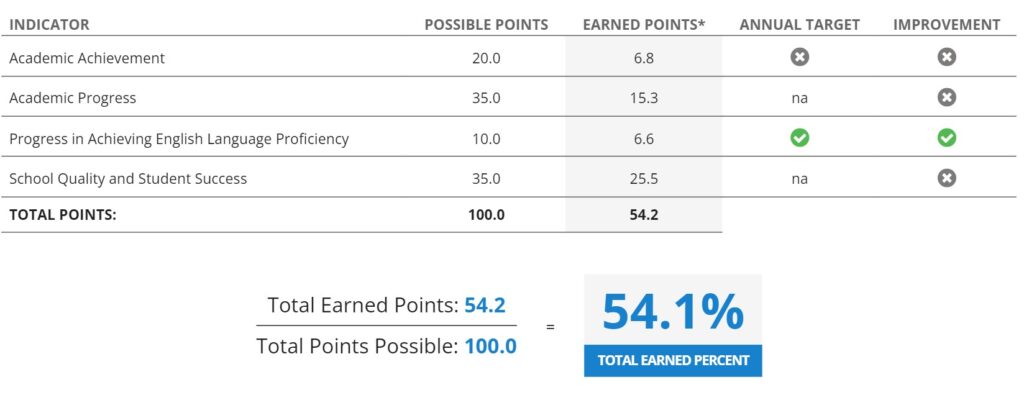
In progress toward English language proficiency for English learners, the school earned 6.6 out of 10 points. The school earned 25.5 out of a possible 35 points for measurements of quality of school environment.
Magnolia did not meet the target for academic measures nor improvement in that category, with 29 points out of a possible 65. In measures of school quality and student success, the school earned 26 of a possible 35 points, which did not show improvement.
Breakdown by demographics shows that overall 7.8 percent of students are proficient in math, with Asian students the most proficient (23.5 percent) and Hispanic/Latinx and students with disabilities the least proficient (5 percent or less proficient). No student groups met the annual target or showed improvement in math. In ELA, 32.7 percent of all students are proficient, with Asian students (of which 58.8 percent test proficient), English learners (27.3 percent proficient) and economically disadvantaged students (21.6 percent proficient) meeting the annual targets. In addition, Black/African American students showed improvement in ELA, with 35.7 percent testing proficient.
Dora Kennedy French Immersion (K-8)
Overall rating: 5 stars
Percentile rank: 89 for elementary, 97 for middle
In Dora Kennedy’s elementary school, 40.6 percent of students were proficient in mathematics and 75.8 percent were proficient in ELA. In the middle school grades 28.3 percent were proficient in math and 73.6 percent in ELA. The elementary grades earned 2.9 out of 5 points for average performance in math and 3.6 out of 5 points for average performance in ELA. The middle school grades earned 2.6 out of 5 points for average performance level in mathematics and 3.5 out of 5 for average performance level in ELA.
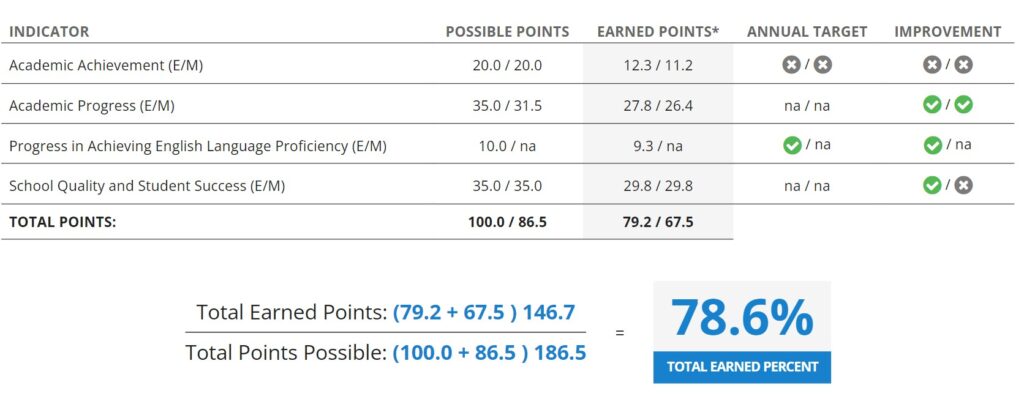
In the elementary school grades 65.6 percent of students were proficient in science, in the middle school grades 52.1 percent. For student growth in math the school earned 10.4 out of 12.5 for both elementary and middle grades and for student growth in ELA it earned 9.4 out of 12.5 in elementary grades and 11.2 out of 12.5 in middle school grades. For well-rounded curriculum the elementary grades earned 4.8 out of 5 and the middle school grades earned 3 out of 3. 92.9 percent of English language learners in the elementary grades were on track to achieve proficiency in English and there was insufficient data at the middle school level. The quality of the school environment earned 29.8 points out of a possible 35 at all levels.
On academic measures the school earned 49 from a possible 65 points, which did not meet the annual target but showed improvement. In school quality and student success it earned 30 points out of 35, also showing improvement.
Overall, at the elementary level, 40.6 percent of all students were proficient in math, which neither met the annual target nor showed improvement. From disaggregated data, no student groups met annual targets in math proficiency nor showed improvement in math, with students with disabilities struggling the most, with only 9.1 percent proficiency. In ELA, however, 75.8 percent of all students were proficient. Broken into student groups, White students performed best in ELA with 93.1 percent proficient and the only group of students not meeting the annual target in ELA was Hispanic/Latinx, with 52.6 percent proficiency.
At the middle school level 28.3 percent of all students were proficient in math, neither meeting the annual target nor showing improvement. Only Hispanic/Latinx students met the annual target for math proficiency in middle school, with 36.4 percent proficient. White students were most proficient at 64.7 percent but that figure neither met the annual target nor showed improvement. The group least proficient in math was economically disadvantaged students with only 11.5 percent proficiency.
In middle school grades 73.6 percent of all students were proficient in ELA, which did not meet the annual target nor show improvement. However, Hispanic/Latinx students met their target with 81.8 percent proficiency and Black/African American students did not meet the annual target but did show improvement with 70.6 percent proficiency in ELA for middle school grades.
Greenbelt Middle School
Overall Rating: 3 stars
Percentile: 57
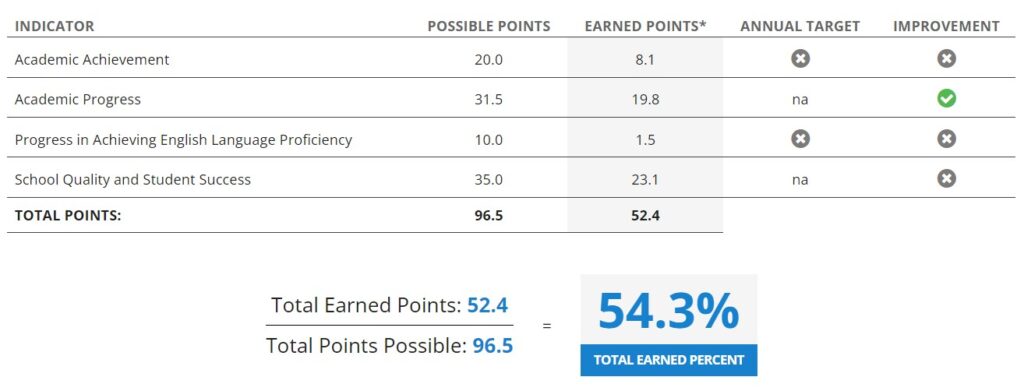
In mathematics, 18.5 percent of students tested proficient and in ELA, 41.5 percent. The school earned 2.2 out of 5 points for the average performance of students in mathematics and 2.9 out of 5 for average performance in ELA. 34.1 percent of students were proficient in science. The school earned 8.4 out of 12.5 for student growth in mathematics, 7.9 out of 12.5 for student growth in ELA and 2.3 out of 3 for well-rounded curriculum.
14.9 percent of English learners were making sufficient progress towards learning English, which gave the school a 1.5 point rating out of 10.
In an assessment of the quality of school environment, the school earned 23.1 out of a possible 35 points. In overall academic measures they received 29 out of a possible 62 points, which did not meet targets or demonstrate improvement. In measures of quality and student success, they earned 23 out of 35 points, which didn’t show improvement.
In student achievement, overall 18.5 percent of all students were proficient in math. The least proficient group in math was the English language learner with 5 percent or less proficiency. The most proficient in math were students in the category of two or more races, of which 50 percent tested proficient, which made them the only group to meet the annual target for math proficiency and the only group to improve.
In ELA, 41.5 percent of all students showed proficiency, which met the annual target and showed improvement. In fact, all student groups improved in ELA and many met the annual targets for proficiency, too (including Asian, Black/African American, White and those identifying as two or more races). White students performed best in ELA, with 80.8 percent testing proficient, while four groups didn’t meet the annual target: Hispanic/Latinx (28.4 percent), students with disabilities (10.9 percent), English learners (9.4 percent) and economically disadvantaged students (25.9 percent).
Eleanor Roosevelt High School
Overall Rating: 4 stars
Percentile Rank: 72
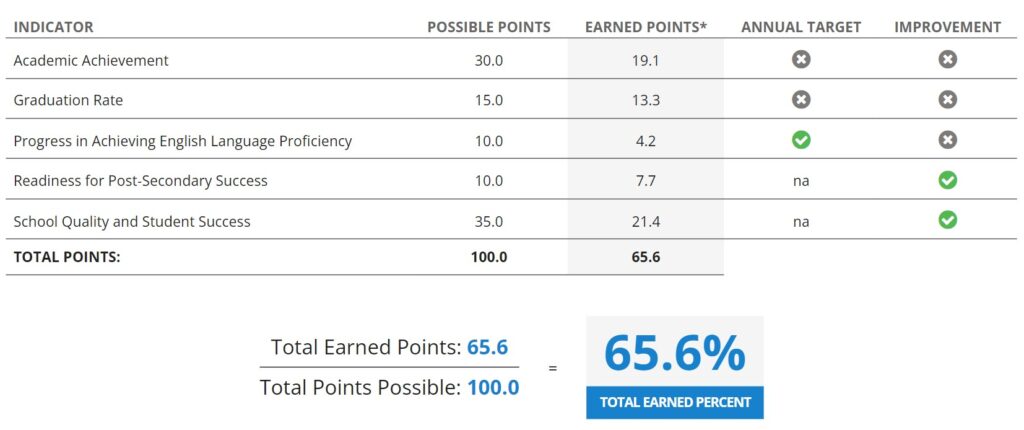
54.9 percent of Roosevelt students were proficient in math and 77.2 percent were proficient in ELA. The school earned 3.3 out of 7.5 in average performance in math and 5.9 out of 7.5 for average performance level in ELA.
The four-year graduation rate was 87.6 percent and the five-year rate was 89.8 percent.
41.7 percent of English learners were making progress on track towards achieving proficiency in English language.
73.8 percent of ninth-grade students were on track for graduation and the school earned 4 out of 5 for well-rounded curriculum. The quality of the school environment was assessed at 21.4 out of 35 points, compiled from measures of chronic absence, access to a well-rounded curriculum and student and educator surveys.
In academic measures, which for high schools combine academic achievement, graduation rate, progress in achieving English language proficiency and readiness for post-secondary success, the school earned 44 out of a possible 65 points, which did not meet the target nor show improvement.
In measures of school quality and student success, which involves a combination of assessing chronic absences, access to well-rounded curriculum and student and educator surveys, the school earned 21 out of 35 points, showing improvement.
In achievement in math, overall, 54.9 percent of students were proficient, which did not meet the annual target nor show improvement. The most proficient in math were Asian students (84.8 percent) closely followed by White (83.1 percent), while only 46.9 percent of Hispanic/Latinx students were proficient – though an improvement for that group ‒ and 45.4 percent of Black/African American students were proficient. The students struggling the most with math proficiency were shown to be students with disabilities and English learners, of which 5 percent or fewer were proficient. 25 percent of economically disadvantaged students were proficient in math, which was an improvement for that group. No groups met the annual target for proficiency in math.
In ELA, 77.2 percent of all students were proficient, meeting the annual target and satisfying the measures of improvement. Broken down by demographic, several groups met the annual target for proficiency in ELA: White students (100 percent proficient), Asian students (91.3 percent proficient), Black/African American students (74.9 percent proficient) and economically disadvantaged students (59.7 percent). Those groups also all demonstrated improvement. Students with disabilities (8.3 percent proficient) and Hispanic/Latinx students (61.1 percent proficient) met neither the annual target nor showed improvement. English learners (17.4 percent proficient) didn’t meet the annual target but showed improvement.
The graduation rate for students overall was 87.64 percent (over four years) and 89.75 percent (over five years), which failed to meet the annual target for students overall or measures for improvement. Asian and White students were the two groups who met the annual targets for both four-year and five-year graduation, with 98.33 percent graduation rate for Asian students and 98.04 for White students. Students with disabilities also met the annual target for the five-year graduation rate with 88.89 percent graduating. Students with disabilities had the lowest four-year graduation rate, with 75.61 percent graduating. Of the five-year cohort, Hispanic/Latinx students had the lowest rate with 81.21 percent graduation.
Other public schools located outside of Greenbelt but serving Greenbelt families include:
Glenarden Woods (TAG) Elementary (2-5) – 5 stars; percentile rank 99
Phyllis E. Williams Spanish Immersion School (Elementary) – 4 stars; percentile rank 57
Robert Goddard Montessori (K-8) – 5 stars; percentile rank of 85 for elementary and 95 for middle
Thomas Pullen Creative and Performing Arts (K-8) – 5 stars; percentile rank 83 for elementary and 94 for middle
College Park Academy Public Charter School (6-12) – 4 stars; percentile rank 69 for middle and 92 for high
Academy of Health Sciences at PGCC (High) – 5 stars; percentile rank 99.
The 2022 Maryland Public Schools Report Card is available at reportcard.msde.maryland.gov and can provide the data for any Maryland public school. The data for how individual students performed on each measure on the State MCAP assessment will be released to parents in coming weeks.


